


1. Introduction to the Indian Cement Industry
1.1 Introduction
The cement industry is one of the core sectors supporting India’s economic development. Cement is the primary binding material used in buildings, roads, bridges, dams, airports, ports and industrial infrastructure. As infrastructure spending, urbanisation and housing demand continue to grow, the cement industry remains a key indicator of economic activity and construction growth.
1.2 What is Cement?
Cement is a finely ground hydraulic binder that hardens when mixed with water and binds sand, aggregates and other construction materials together. Modern cement is manufactured mainly from limestone, clay and other minerals through a carefully controlled industrial process.
1.3 Evolution of the Indian Cement Industry
| Period | Major Development |
| Before 1991 | Government-regulated production and pricing |
| 1991–2005 | Liberalisation and capacity expansion |
| 2005–2020 | Infrastructure boom and industry consolidation |
| 2020–2026 | Capacity additions, sustainability and green manufacturing |
1.4 Cement Manufacturing Value Chain
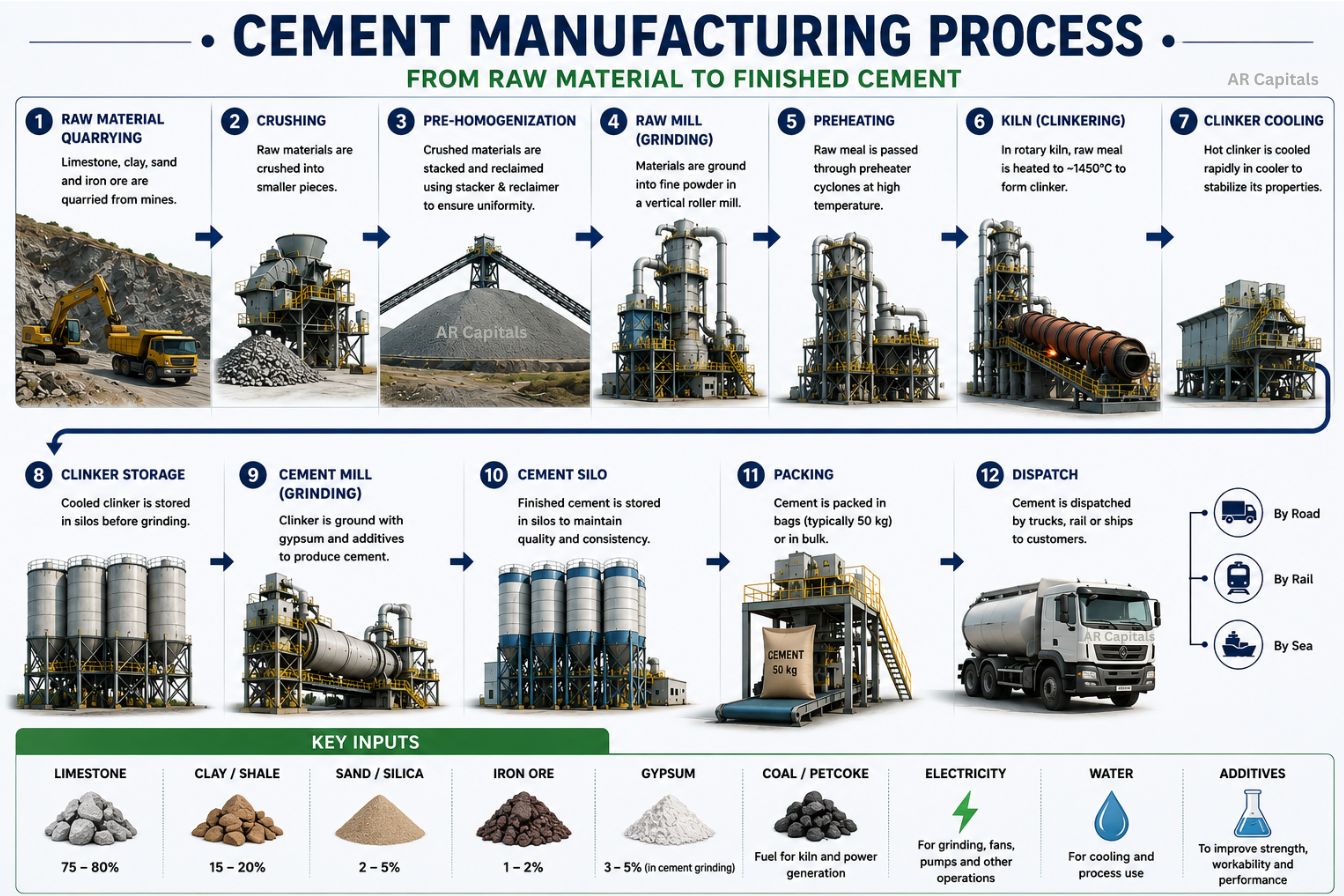
Limestone Mining → Crushing → Raw Mill → Preheater → Rotary Kiln → Clinker → Cement Grinding → Storage → Packing → Dispatch
1.5 Types of Cement
| Type | Description | Common Use |
| OPC | Ordinary Portland Cement | General construction |
| PPC | Portland Pozzolana Cement | Residential & infrastructure |
| PSC | Portland Slag Cement | Marine & industrial structures |
| White Cement | Decorative cement | Architectural finishes |
| Rapid Hardening Cement | High early strength | Roads & precast works |
1.6 Key Raw Materials
- Limestone (primary raw material)
- Clay or Shale
- Sand / Silica
- Iron Ore
- Gypsum
- Coal / Petcoke or alternative fuels
- Electricity and Water
1.7 Indian Cement Industry Overview (2026)
India is the world’s second-largest cement producer and one of the fastest-growing cement markets. Demand is supported by government infrastructure projects, affordable housing, commercial construction and industrial expansion. Large listed companies continue to expand production capacity while focusing on energy efficiency and lower carbon emissions.
1.8 Growth Drivers
- Government infrastructure investment
- Urbanisation and housing demand
- Road, railway and metro projects
- Industrial and logistics parks
- Capacity expansion by major cement producers
- Green and sustainable construction
1.9 Leading Indian Cement Companies
| Company | Key Strength |
| UltraTech Cement | Largest producer with pan-India presence |
| ACC | Established brand and distribution |
| Ambuja Cements | Operational efficiency |
| Shree Cement | Low-cost producer |
| Dalmia Bharat | Strong South & East India presence |
| Ramco Cements | Southern market leadership |
| JK Cement | Grey and white cement |
1.10 Investor Insight
Cement demand generally follows infrastructure spending and real estate activity. Investors should monitor capacity utilisation, regional pricing, fuel costs, logistics expenses and expansion projects when evaluating cement companies.
2. How Cement Companies Make Money
2.1 Introduction
Cement companies earn revenue by manufacturing cement and selling it to dealers, distributors, contractors, infrastructure companies and real estate developers. Profitability depends on production efficiency, plant utilisation, pricing power, fuel costs, freight expenses and demand from the construction sector.
2.2 Cement Business Model
Raw Materials → Clinker Production → Cement Grinding → Packing → Distribution → Dealers / Projects → Customers
2.3 Sources of Revenue
| Revenue Source | Description | Contribution |
| Bagged Cement | Retail sales through dealers | High |
| Bulk Cement | Infrastructure & industrial projects | High |
| Premium Cement | Specialty cement products | Growing |
| Clinker Sales | Sale of clinker to other manufacturers | Moderate |
| By-products | Waste heat power, fly ash related income | Low |
2.4 Major Cost Components
| Cost Component | Impact |
| Limestone Mining | Primary raw material cost |
| Coal / Petcoke / Alternative Fuel | Largest energy cost |
| Electricity | Grinding and plant operations |
| Freight & Logistics | Transport to dealers and projects |
| Packaging | Cement bags and handling |
| Employee & Maintenance | Plant operations and upkeep |
2.5 Factors That Drive Profitability
- Capacity utilisation
- Regional cement prices
- Fuel and power costs
- Freight efficiency
- Operational efficiency
- Product mix (OPC, PPC, PSC and premium cement)
2.6 Working Capital Cycle
Raw Material Procurement → Manufacturing → Inventory → Dealer Sales → Customer Collection → Cash Reinvestment
2.7 Practical Example
If a cement company produces one million tonnes annually and improves capacity utilisation while reducing fuel and freight costs, operating margins can increase even if selling prices remain stable. Efficient plants generally generate stronger cash flows than inefficient producers.
2.8 Investor Insight
The strongest cement companies combine low production costs, efficient logistics, strong brands, wide dealer networks and disciplined capacity expansion. Investors should monitor EBITDA per tonne, capacity utilisation, power and fuel costs, and debt levels rather than focusing only on revenue growth.aceutical companies increasingly compete through complex generics, specialty formulations, biosimilars and CDMO services rather than only low-cost manufacturing.
3. How to Analyse Cement Companies
3.1 Introduction
Cement companies should be analysed differently from businesses in other industries. Their profitability depends on production efficiency, capacity utilisation, regional pricing, logistics costs and effective capital allocation. Investors should evaluate both operational and financial performance before making investment decisions.
3.2 Step-by-Step Analysis Framework
| Area | What to Analyse |
| Production Capacity | Installed capacity and planned expansions |
| Capacity Utilisation | Percentage of plant utilisation |
| Sales Volume | Cement and clinker sales growth |
| Pricing | Average cement realisation per tonne |
| Cost Structure | Power, fuel, freight and raw material costs |
| Profitability | EBITDA per tonne and operating margin |
| Financial Strength | Debt, cash flow, ROCE and ROE |
| Management | Execution, capital allocation and governance |
3.3 Key Financial & Operating Metrics
| Metric | Meaning | Why It Matters |
| Capacity Utilisation | Plant usage percentage | Higher utilisation improves profitability |
| EBITDA per Tonne | Operating profit per tonne sold | Measures operating efficiency |
| Realisation per Tonne | Average selling price | Indicates pricing power |
| Cost per Tonne | Manufacturing cost per tonne | Lower cost improves margins |
| Power & Fuel Cost | Energy expenditure | Major cost component |
| Freight Cost | Transportation expense | Important for regional competitiveness |
| ROCE | Return on Capital Employed | Capital efficiency |
| ROE | Return on Equity | Shareholder returns |
| Debt-to-Equity | Financial leverage | Lower debt reduces risk |
| Operating Cash Flow | Cash generated from operations | Shows business quality |
3.4 Investor Checklist
| Question | Yes / No | Remarks |
| Is capacity utilisation improving? | ||
| Is EBITDA per tonne increasing? | ||
| Are power and fuel costs under control? | ||
| Is freight cost efficiently managed? | ||
| Is operating cash flow consistently positive? | ||
| Is debt at a comfortable level? | ||
| Is ROCE above industry average? | ||
| Does the company have a strong distribution network? | ||
| Is management executing expansion projects efficiently? |
3.5 Red Flags
- Low capacity utilisation for several quarters
- Sharp decline in EBITDA per tonne
- Rising debt without proportional capacity expansion
- Persistent negative operating cash flow
- Frequent project delays
- Weak pricing power in core markets
- Poor corporate governance or related-party concerns
3.6 Investor Insight
The best cement companies are usually those with low production costs, efficient logistics, diversified geographical presence, strong dealer networks and disciplined capacity expansion. Investors should compare companies on a per-tonne basis rather than relying only on revenue or profit growth.d earnings growth.
4. Risks in the Cement Industry
4.1 Introduction
The cement industry is capital-intensive and cyclical. Although long-term demand is supported by infrastructure development and urbanisation, profitability can fluctuate because of raw material prices, fuel costs, logistics expenses and economic conditions. Investors should understand these risks before evaluating cement companies.
4.2 Major Risks in the Cement Industry
| Risk | Impact |
| Demand Risk | Slowdown in construction and infrastructure reduces cement demand. |
| Fuel & Energy Cost | Higher coal, petcoke, gas and electricity prices reduce margins. |
| Raw Material Risk | Limited access to quality limestone or higher mining costs affect production. |
| Freight & Logistics Risk | High transportation costs reduce profitability because cement is bulky. |
| Pricing Pressure | Intense regional competition may reduce selling prices. |
| Environmental Regulations | Stricter emission norms increase compliance and capital expenditure. |
| Capacity Expansion Risk | Excess industry capacity can create pricing pressure. |
| Interest Rate Risk | Higher borrowing costs affect expansion projects and housing demand. |
| Working Capital Risk | Delayed collections from dealers or projects affect cash flow. |
| Climate & Weather Risk | Heavy monsoons or extreme weather may disrupt construction activity. |
4.3 Risk Indicators Investors Should Monitor
| Indicator | Healthy | Warning Sign |
| Capacity Utilisation | High and improving | Persistently low |
| EBITDA per Tonne | Stable or rising | Sharp decline |
| Debt-to-Equity | Moderate | Rapid increase |
| Operating Cash Flow | Positive | Negative for long periods |
| Fuel Cost | Stable | Continuous increase |
| Realisation per Tonne | Stable pricing | Weak regional pricing |
4.4 How Leading Cement Companies Manage Risk
- Secure long-term limestone reserves.
- Improve energy efficiency through waste heat recovery systems.
- Increase the use of alternative fuels and renewable energy.
- Expand geographically to reduce regional demand dependence.
- Strengthen dealer and distribution networks.
- Maintain disciplined capital allocation and debt management.
4.5 Investor Red Flags
Repeated environmental or regulatory violations.
Falling capacity utilisation over multiple quarters.
Declining EBITDA per tonne.
Rapid increase in debt without corresponding capacity growth.
Persistent negative operating cash flow.
High dependence on a single geographic market.
5. Future of the Indian Cement Industry (2026–2035)
5.1 Introduction
India’s cement industry is expected to witness steady long-term growth, supported by rising infrastructure investments, urbanisation, industrialisation and government housing initiatives. Increasing demand from roads, railways, metro projects, commercial construction and manufacturing facilities is likely to keep cement consumption on an upward trajectory over the next decade.
5.2 Key Growth Drivers
- Government infrastructure spending
- Affordable housing and urban development
- Expansion of highways, railways, airports and ports
- Growth in industrial corridors and logistics parks
- Increase in commercial and residential real estate
- Capacity expansion by major cement manufacturers
- Growing demand from rural housing
5.3 Emerging Industry Trends
| Trend | Impact |
| Green Cement | Lower carbon emissions and sustainable construction |
| Alternative Fuels | Reduced dependence on coal and petcoke |
| Waste Heat Recovery Systems | Lower energy costs and improved efficiency |
| Digital Manufacturing | Improved plant productivity and predictive maintenance |
| Artificial Intelligence | Better demand forecasting and process optimisation |
| Renewable Energy | Reduced operating costs and environmental impact |
5.4 Government Initiatives
- PM Gati Shakti National Master Plan
- National Infrastructure Pipeline (NIP)
- Pradhan Mantri Awas Yojana (PMAY)
- Smart Cities Mission
- Bharatmala Pariyojana
- Sagarmala Programme
- Make in India
5.5 Opportunities for Investors
Companies with modern plants, efficient logistics networks, diversified regional presence, strong limestone reserves, healthy balance sheets and disciplined capacity expansion are expected to benefit the most from India’s long-term cement demand growth.
5.6 Challenges Ahead
- Volatility in fuel and energy prices
- Environmental compliance costs
- Intense regional competition
- Freight and logistics expenses
- Climate-related operational disruptions
- Overcapacity in certain regions
5.7 Investor Outlook
Long-term investors should focus on cement companies that consistently improve capacity utilisation, maintain strong EBITDA per tonne, generate healthy operating cash flows and invest in sustainable manufacturing technologies. Businesses with efficient cost structures and prudent capital allocation are more likely to deliver superior shareholder returns over the long term.
References:
- Ministry of Commerce & Industry, Government of India. Annual Reports and industry publications (Accessed: 2026).
- Department for Promotion of Industry and Internal Trade (DPIIT). Infrastructure & Manufacturing Updates (2026).
- India Brand Equity Foundation (IBEF). Cement Industry Report (Updated: 2026).
- Ministry of Statistics and Programme Implementation (MoSPI). National Accounts & Infrastructure Statistics (2026).
- NITI Aayog. Infrastructure and Manufacturing Reports (2025–26).
- CRISIL. Cement Sector Outlook 2025–26.
- CARE Ratings. Indian Cement Industry Reports (2025–26).
- ICRA. Cement Industry Outlook (2025–26).
- World Cement Association. Industry Publications.
- Global Cement Magazine. Industry Analysis (2025–26).
- Annual Reports (2025–26): UltraTech Cement, Ambuja Cements, ACC, Shree Cement, Dalmia Bharat, The Ramco Cements, JK Cement.
Disclaimer:
This guide has been prepared solely for educational and informational purposes. The information has been compiled from publicly available government publications, industry reports, rating agency reports and company annual reports believed to be reliable as of 2026. It should not be treated as investment advice or a recommendation to buy or sell any security. The cement industry is influenced by economic conditions, government policies, raw material prices and market dynamics. Readers should conduct their own research and consult a qualified financial advisor before making investment decisions. While every effort has been made to ensure accuracy, AR Capitals does not guarantee the completeness or timeliness of the information presented.